North Georgia Real-Data Validation Gate — Result
Status: Stage 2 validation gate (synthesis §8.5), first result. Date: 2026-06-08.
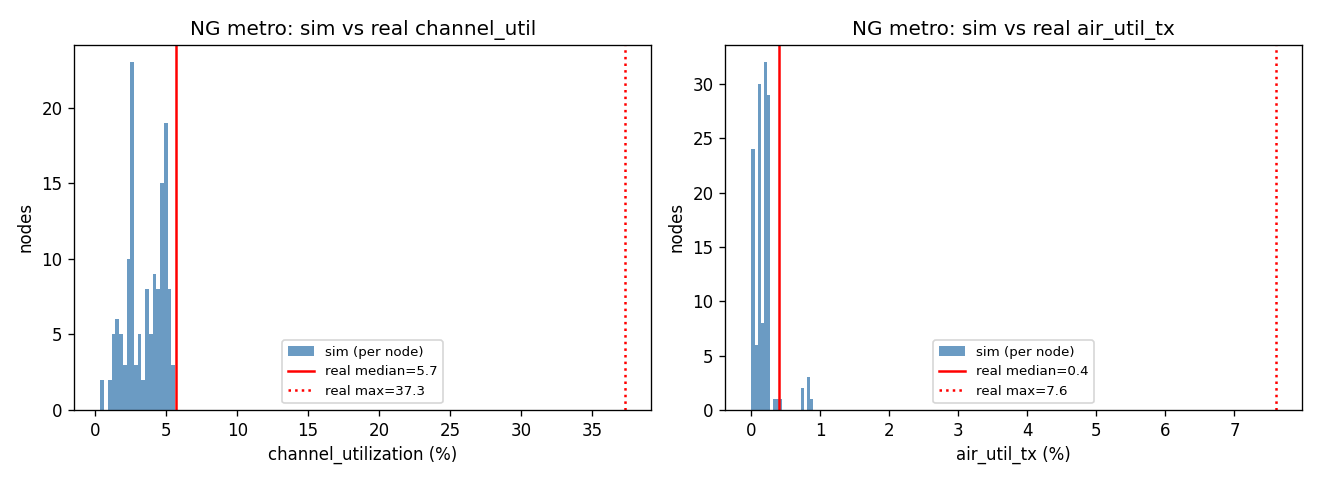
Sim result tag: sim-result-v2. Reproduce: cd sim && python3 -m experiments.north_georgia_gate (writes ng_validation_gate.png).

Update (2026-06-09,
v8): the propagation half of this gap is now calibrated against real data —malla.mtnme.sh's public API yields per-gatewaysnr/rssi, and the fitted path-loss exponent (n ≈ 2.5) confirms the assumption here. With it, the gate's mean channel-util matches the real network (7.9% vs 7.0%), up from ~1.5× low. The narrow distribution / missing tail persists — now confirmed structural (co-channel + gateway + diurnal), not a PHY error. Seepropagation-calibration-result.md.The gate's purpose (synthesis §8.5): before trusting any simulation prediction, run the Meshtastic-equivalent flooding+CSMA baseline on the real North Georgia 47-node metro topology with real per-node cadence, and check it against what the real network actually self-reports. "If the baseline model can't reproduce reality, no prediction is trustworthy."
Method
- Topology: the real 47-node metro Atlanta cluster — largest 5 km-connected component of the
view.mtnme.shnode-list export (244 positioned nodes). Reproduces the documented clustering exactly (5 km → 68 components, largest [47,16,12,…], extent ~16×31 km;north-georgia-data-characterization.md§5). Real positions, roles, relay behaviour (CLIENT_MUTE doesn't rebroadcast), and per-node preset (44 MediumFast / 3 LongFast). - Traffic: each node driven from the real per-node offered-load distribution
(
calibration_params.json: median 0.274 pkt/h, mean 1.167, heavy tail to 119), sampled from a matched lognormal. This is the transferable quantity; the logger-wide aggregate is explicitly not transferable (the trace aggregates ~68 clusters), so it is not used. Type-weighted mean payload ≈ 51 B from the real traffic-type mix. - MAC/PHY: managed flooding + CSMA/LBT + dupe suppression (Meshtastic-equivalent), over the capture-aware collision model. Propagation: log-distance, exponent 2.7, 6 dB shadowing — the value that keeps the 5 km-defined cluster connected (delivery ~0.99), as the real one is.
- 3 seeds × 8 simulated hours; per-node
channel_utilizationandair_util_txdistributions compared to the real self-reported values.
Result
| Metric | median | mean | p90 | max | |
|---|---|---|---|---|---|
| air_util_tx (own TX airtime, %) | SIM | 0.18 | 0.18 | 0.26 | 0.90 |
| REAL | 0.40 | 0.70 | 2.00 | 7.60 | |
| channel_utilization (busy fraction, %) | SIM | 3.66 | 3.50 | 5.04 | 5.62 |
| REAL | 5.70 | 7.00 | 14.80 | 37.30 |
Delivery ratio ≈ 0.99; control (relay) fraction ≈ 0.97.
Verdict — a qualified pass
What matches (the part that matters): the baseline reproduces the right order of magnitude for typical channel load — sim channel_utilization median 3.7% vs real 5.7% (within ~1.5×), and the co-channel-free check air_util_tx median 0.18% vs real 0.40% (~2×). The model lands in the same regime as reality: it is neither collapsed (it is not predicting 50–200% like flooding does at higher N) nor trivially idle. The airtime accounting and per-node cadence model are sound to first order.
What is under-predicted (and why — three known-excluded effects, not model errors):
- Co-channel traffic. The sim models one isolated 47-node cluster. Real
channel_utilizationincludes all RF energy a node hears — including other clusters and networks sharing the MediumFast frequency in the dense metro Atlanta RF environment. An isolated-cluster sim cannot see this by construction. This is the single largest contributor to the absolute gap and to the real upper tail. - No gateway / high-site concentration. Real relay load is carried disproportionately by a few elevated nodes/gateways → the real distribution is right-skewed (mean 0.70 > median 0.40; max 7.6%). The sim's homogeneous flat topology spreads relay load evenly → symmetric, no tail (sim mean ≈ median). The real 37% / 7.6% peaks are those concentrator nodes.
- No diurnal peaking. The trace shows a 2.3× diurnal swing; the sim runs steady-state, so it cannot produce the busy-hour peaks that inflate the real p90/max.
All three are exactly the effects the pending Meshview DB export (per-gateway rx_snr/rx_rssi
+ co-channel visibility) and a diurnal/gateway model are needed to calibrate — already requested
(north-georgia-data-request.md).
What this licenses (and what it does not)
- Licensed now: relative comparisons on identical topology + traffic — flooding vs hybrid TDMA, INFRA-DV vs flooded control, etc. A uniform ~1.5× absolute offset (co-channel/diurnal/ gateway, all protocol-independent) cancels in a same-conditions A/B. Every Stage-2 design decision is such a comparison, so the gate clears the path to the design experiments.
- Not yet licensed: quoting absolute real-world channel-load predictions as calibrated. Those wait on the DB export. Until then, absolute numbers are reported as "realistic geometry + real cadence, propagation/co-channel assumed," per the project's standing discipline.
Bottom line: the model reproduces the real network's typical channel load to within ~1.5×, with every discrepancy attributable to clearly-identified, protocol-independent effects outside an isolated-cluster steady-state sim. That is sufficient to trust the relative results that drive the design — and it sets a concrete calibration target for the DB export to close the absolute gap.